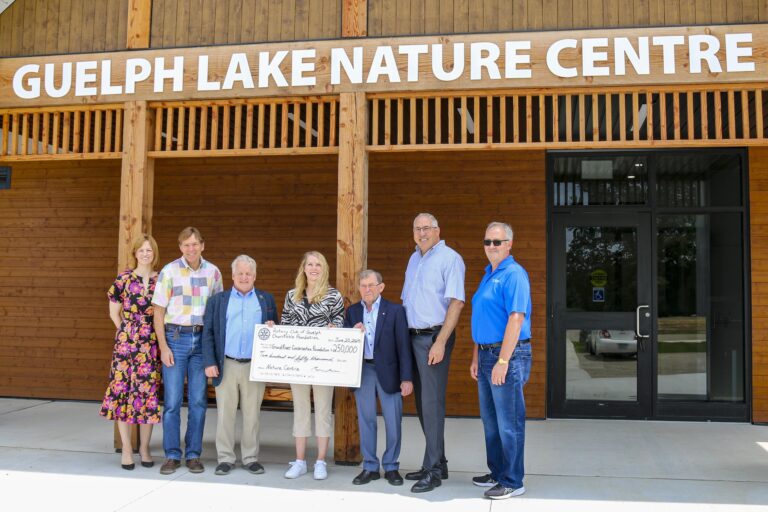
Wednesday, July 2, 2025


The North American Land Change Monitoring System (NALCMS) has released a new map product depicting land cover change across North America.
The maps tell a story of changes in the North American environment over the time period of 2010 – 2015, including: landslides, oil sands expansion, water-level changes, deforestation or forest recovery, conversion to cropland, mining expansion, and much more.
NALCMS is a joint initiative among Natural Resources Canada (NRCan)’s Canada Centre for Mapping and Earth Observation (CCMEO), the United States Geological Survey (USGS), and three Mexican organizations: the National Institute of Statistics and Geography (Instituto Nacional de Estadística y Geografía—INEGI), the National Commission for the Knowledge and Use of Biodiversity (Comisión Nacional para el Conocimiento y Uso de la Biodiversidad—Conabio), and the National Forestry Commission (Comisión Nacional Forestal—Conafor), and supported by the Commission for Environmental Cooperation (CEC).
All these changes are captured by satellites, and thanks to trinational collaboration, these maps now provide valuable resources for a variety of environmental research.
Three environmental issues depicted by the maps:
- Forest Fires in Canada’s Northwest Territories, in 2014, caused large areas around Yellowknife to change from forest to mainly grassland and barren lands. Unusually warm conditions and lack of rainfall triggered more than 130 forest fires in the area surrounding Great Slave Lake and created a forest fire season that year that has been classified as one of the most extreme in the region over the last three decades, with a lasting impact on vegetation and wildlife as well as on human populations.
- The conversion of Wetlands to Aquaculture in Sinaloa, Mexico. The coastal area of Sinaloa now hosts one of the largest shrimp-farming regions in the country, with sixty percent of Mexico’s shrimp aquaculture production now concentrated in this state, intended for the national and international market. But originally this coastal region was the site of considerable wetland and mangrove habitat. When comparing 2010 to 2015, the impact of increased flooding of the land is apparent. This includes coastal modification, especially near bays and estuaries, changes to agricultural soil, and urban expansion due to economic activity.
- The rapid expansion of Urban Sprawl in the Dallas-Fort Worth Area, United States. Fort Worth, with one of the lowest unemployment rates in the country, has grown rapidly over the period, due to the development of the aerospace, pharmaceutical, and food industries, among others. In 2018, Fort Worth became the metropolitan area with the highest annual growth rate in the nation, with an increase of 146,000 inhabitants in just that year.
These new geospatial maps, created from a composite of images assembled from satellite observations (Landsat), depict land cover change across North America from 2010 to 2015 at a 30-metre spatial resolution.
For further information, click here: North American Land Change Monitoring System